New Google Search Console Reports: Measuring Visibility in AI Overviews, AI Mode and Visual Search
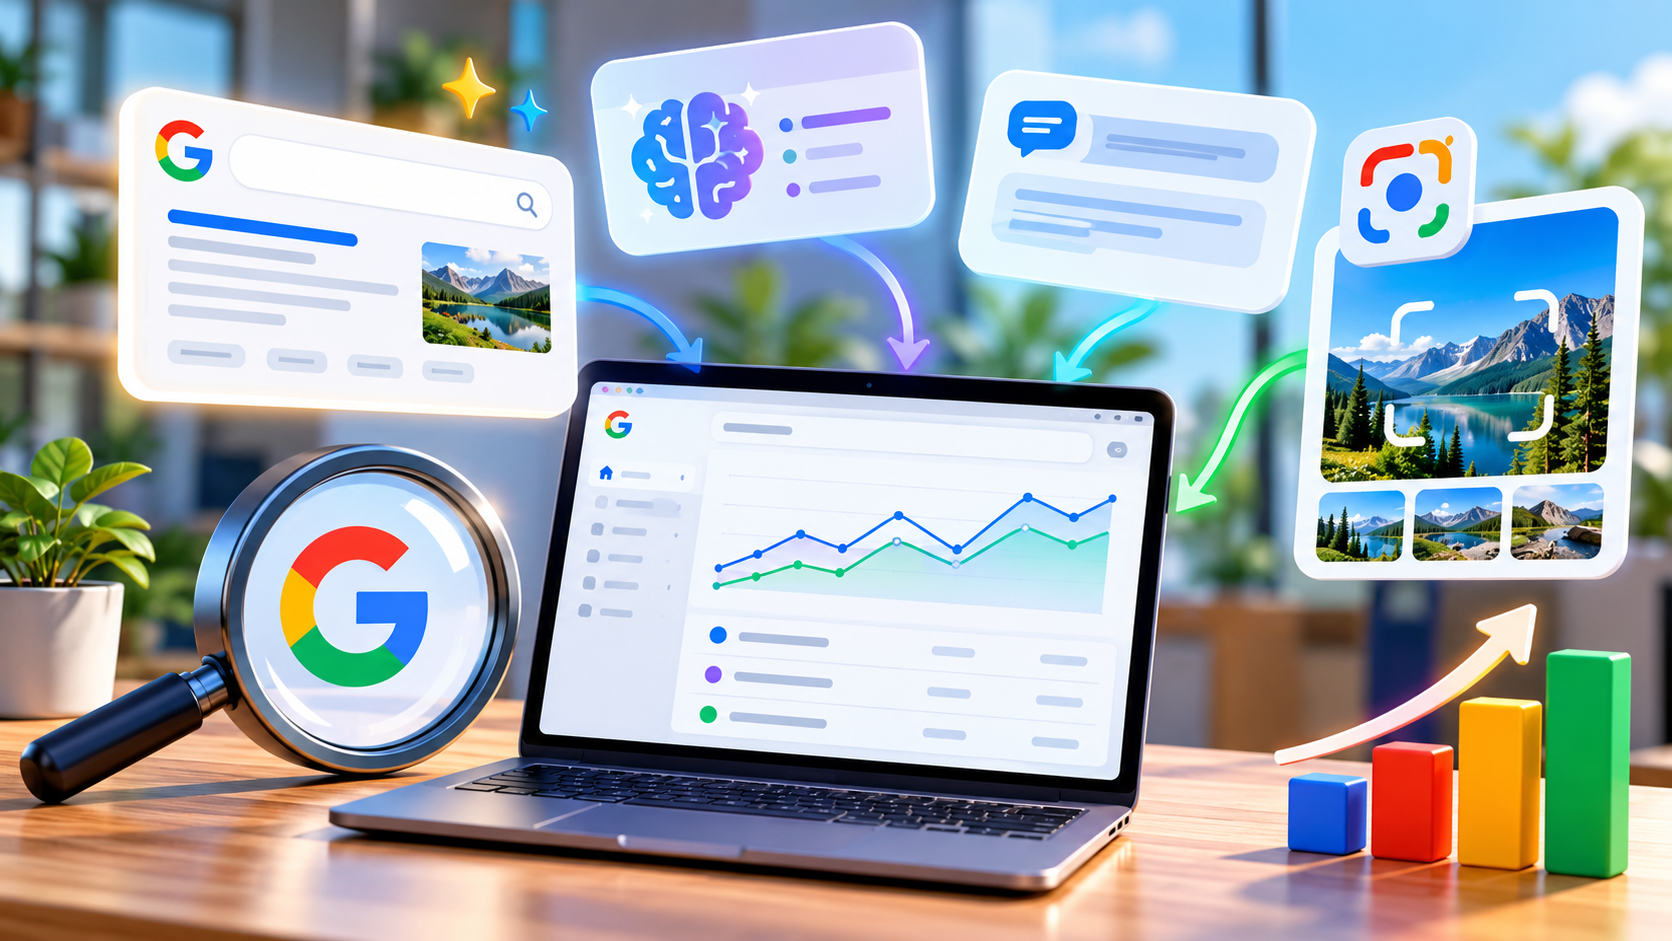
Google Search Console changed significantly in 2026, giving website owners clearer information about how their content appears in AI-generated answers and image-based searches. The new Generative AI performance reports cover AI Overviews, AI Mode and AI features in Discover, while a separate multimodal search filter helps identify activity originating from Google Lens and similar visual search tools. These additions address an important problem for businesses: a website can appear prominently in Google without receiving a traditional search click. Understanding this visibility now requires looking beyond organic traffic totals and examining where content appears, which pages receive exposure and whether that attention eventually brings valuable visitors.
What Changed in Google Search Console Reporting in 2026?
On 3 June 2026, Google announced dedicated Generative AI performance reports for Search and Discover. The company subsequently confirmed that these insights had been rolled out worldwide by 31 August. Previously, impressions and clicks associated with AI Overviews and AI Mode were incorporated into general search performance figures, making it difficult to distinguish conventional search activity from exposure within AI-generated results. The new reporting introduces a separate view of impressions in supported AI features, allowing website owners to identify which pages Google presents as sources within these experiences. Importantly, this is additional reporting rather than a replacement for the existing Performance reports.
The distinction between AI Overviews and AI Mode matters when interpreting the figures. AI Overviews present AI-generated summaries within conventional Google results, often accompanied by links to supporting websites. AI Mode provides a more conversational search experience in which users can ask detailed questions and continue with follow-up requests. Both can introduce a business to potential customers before those customers visit its website. However, the dedicated Generative AI report focuses on impressions rather than providing a complete account of user engagement. It should not be interpreted as a dashboard showing how many customers AI recommendations have generated or how often a particular brand has been mentioned in an answer.
Another major update arrived on 24 September 2026, when Google announced reporting for multimodal web searches. These include searches started with Google Lens, Circle to Search on Android, uploaded pictures and Chrome’s image-search functionality. A shopper might photograph a chair to find similar products, while a homeowner might search using a picture of an unfamiliar appliance component. The new filter makes it possible to examine this activity separately from searches typed into Google’s conventional search box. Google introduced the functionality through a global rollout, although individual websites need relevant search activity before useful figures become available. Together, these changes give businesses a more detailed understanding of how their content reaches people across different search experiences.
Where to Find the New Reports and Understand Their Metrics
Start by opening your verified website property in Google Search Console and locating the Generative AI performance report for Search. The report displays impressions associated with supported AI features, including AI Overviews and AI Mode. Select a suitable date range and examine the Pages, Countries, Devices and Dates views. The Pages view identifies which URLs received exposure, while the other views help establish where and when that exposure occurred. Google attributes most page-level performance information to canonical URLs, so the address shown may differ from a particular version of the page. If the report is missing, Google explains that the property may not have accumulated enough qualifying impressions. An absent report therefore does not automatically indicate an indexing problem.
Impressions need careful interpretation. An impression means that a link to the website was shown under Google’s applicable reporting rules, not that somebody visited the page, recognised the brand or made a purchase. In the Generative AI chart, results are aggregated at property level. If two links from the same website appear within one qualifying result, the chart can count a single property impression. Page-level tables follow different aggregation rules, meaning their totals will not always match the main chart. Recent figures may also be preliminary. For meaningful comparisons, use completed reporting periods and retain the same date range, country and device settings whenever possible.
To assess visual search, open the standard Search results Performance report and use the Search type filter. Select Web: multimodal to examine searches initiated using images, or Web: text-based for conventional text queries. The separate Image search type measures performance in Google Images and should not be confused with multimodal web search. The Generative AI report also supports the text-based and multimodal distinction, making it possible to examine AI impressions originating from these different search methods. Export the figures when preparing regular business reports, and keep the categories clearly labelled. Google’s official documentation at Generative AI performance report (Search) explains the measurements and limitations in more detail.
How to Measure Website Visibility Across AI and Visual Search
The most useful starting point is to establish a baseline before making changes to the website. Record the total number of Generative AI impressions for the previous complete month, identify the pages responsible for the largest share and compare their performance with an earlier equivalent period where data is available. For example, a page receiving 12,000 AI impressions in September and 15,000 in October has increased its reported exposure by 25%. This is a meaningful visibility change, but it does not prove that the page attracted 25% more visitors. The comparison becomes more informative when the website’s overall search impressions, seasonal demand and content changes are considered alongside the AI figures.
Next, assess the pages rather than relying entirely on website-wide totals. A retailer might find that buying guides receive most AI impressions, while product category pages generate more clicks through conventional search. A consultancy could see its detailed explanations appearing in AI answers even though its service pages receive fewer impressions. Such differences help reveal which content answers initial research questions and which supports customers who are closer to taking action. Compare each important page’s AI exposure with its standard search performance, paying attention to changes in impressions, clicks and click-through rate. These measurements describe related aspects of visibility, but they are not interchangeable.
Geography and device usage provide another useful layer of analysis. A British business serving customers only within the UK should not judge success solely by a rise in worldwide AI impressions. Exposure in countries where it cannot sell or provide services may have limited commercial value. Similarly, mobile visibility can be particularly important for local searches, retail browsing and searches started with a smartphone camera. Use the Countries and Devices views to identify where impressions originate, then compare those findings with the audience the business actually wants to reach. A smaller increase among relevant UK customers can be more useful than a much larger increase in markets outside the company’s service area.
Connecting Search Console Data With Traffic, Engagement and Business Results
Search Console provides the visibility figures, while Google Analytics 4 helps explain what visitors do after arriving on the website. Review organic search sessions, engaged sessions, important events and conversions alongside Search Console performance. For an online shop, relevant events might include adding products to a basket, beginning checkout and completing purchases. A service business could measure submitted enquiries, appointment bookings and qualified contact requests. These comparisons help determine whether improvements in search visibility coincide with useful business activity. However, Google Analytics does not automatically establish which visits originated specifically from AI Overviews or AI Mode, so avoid presenting ordinary organic search conversions as confirmed AI-driven conversions.
Consider a practical example using hypothetical figures. A business records 40,000 Generative AI impressions during one month, compared with 32,000 in the previous month. Over the same period, its conventional organic search clicks rise from 8,500 to 8,900, while completed enquiry forms increase from 110 to 125. The results show improving AI exposure, modest growth in search visits and an increase in enquiries. They do not establish that AI visibility caused the additional enquiries. Other factors, including seasonal interest, better page content, advertising activity or changes to the enquiry form, may have contributed. The appropriate next step is to investigate which pages improved and whether their visitors demonstrated stronger engagement.
For routine reporting, create a monthly record containing AI impressions, leading pages, geographic distribution, device distribution, conventional search clicks and relevant business conversions. Add multimodal impressions as a separate measurement for websites with substantial visual content. Record major website changes, such as publishing new buying guides, updating photographs or revising service descriptions, so performance movements can be examined in context. Where possible, compare several complete months rather than reacting to individual days. This approach creates a dependable history without pretending that every appearance in an AI-generated answer can be traced to a sale. It also provides management with a clearer explanation of what the website is achieving beyond traditional ranking positions.

How Businesses Can Improve Visibility Using the New Search Data
The new reports become especially useful when they inform specific content decisions. Begin with pages already receiving considerable AI exposure, because Google is demonstrating that their information is relevant to at least some supported AI search experiences. Examine whether those pages answer practical questions accurately and completely. A product guide should explain important differences, limitations, prices where appropriate and suitability for particular customers. A professional services page should clearly describe the service, who provides it and what customers can expect. Where information changes frequently, update the relevant details rather than adding unnecessary paragraphs. Google’s guidance continues to emphasise helpful, original and trustworthy content instead of special techniques supposedly designed to manipulate AI-generated answers.
Make factual information easy to verify. Publish accurate author details where relevant, identify the business responsible for the website and support important claims with appropriate evidence. Original photographs, first-hand observations, clearly explained research and genuine product testing can make a page more useful than a generic summary of information available elsewhere. These practices also align with Google’s experience, expertise, authoritativeness and trustworthiness principles, commonly called E-E-A-T. Google does not describe E-E-A-T as a single ranking score, and adding an author’s biography cannot guarantee inclusion in AI results. The practical objective is to help readers establish whether information is reliable and whether it adequately answers their questions.
For visual searches, concentrate on images that genuinely represent the subject of the page. Retailers should provide clear product photographs showing relevant details, alternative angles and distinguishing characteristics. Travel businesses can include accurate photographs of accommodation and facilities, while repair companies may benefit from labelled examples of components or completed work. Use descriptive filenames and alternative text that identifies the image naturally, and place pictures near relevant written explanations. Ensure images are accessible to Google’s crawlers and that the surrounding pages can be indexed. These measures support image understanding and ordinary SEO, but no image format, filename or structured data property guarantees inclusion in Google Lens or AI-generated search results.
A Practical Monthly Review for Search Visibility in 2026
During the first working week of each month, review the previous complete month’s Search Console reports. Begin with total Generative AI impressions and the pages showing the largest increases or decreases. Compare these with the conventional Search results report, looking for changes in clicks and impressions on the same pages. If a guide gains AI exposure but loses organic clicks, investigate the topic and the current search results before making assumptions. Users may be receiving sufficient information directly from search, but changing rankings, competing websites and shifts in demand could also explain the difference. Search Console figures alone cannot reliably determine which explanation is responsible.
Next, review the multimodal search figures and identify pages associated with visual discovery. An ecommerce business might prioritise categories where photographs are essential to product selection, such as furniture, clothing or decorative accessories. A property business could examine whether pages containing useful interior images receive increased exposure. Check that the photographs correspond to the actual products or services, that pages contain sufficient supporting information and that visitors can easily continue towards their intended action. Keep a written record of any improvements and their publication dates. This makes later comparisons more credible and prevents teams from attributing every positive change to the most recent edit.
Finally, prepare a short business summary distinguishing visibility, website visits and commercial outcomes. State the number of reported AI impressions, describe which content gained or lost exposure and identify any notable differences between text-based and multimodal searches. Include organic traffic and conversion trends without claiming a direct causal relationship that the available reports cannot demonstrate. Agree on a small number of actions for the following month, such as improving an outdated guide, replacing inaccurate product photographs or strengthening information on an important service page. The purpose of the new Google Search Console reports is not simply to produce more figures. It is to understand how customers encounter a business in modern search and use that evidence to improve the information they receive.